Thinking in Systems with DiagrammeR
I recently read Thinking in Systems: A Primer by Donella H. Meadows (2008) for a book club. The book offers a great little primer on systems thinking and its application to problems big and small. It’s a quick read (< 200 pages, not counting the appendix), and it has many great tidbits on how to perceive and influence the systems around us.
One of the concepts introduced in the book is stock and flow diagrams that represent basic systems. The first diagram in the book shows a basic stock with an inflow and outflow.
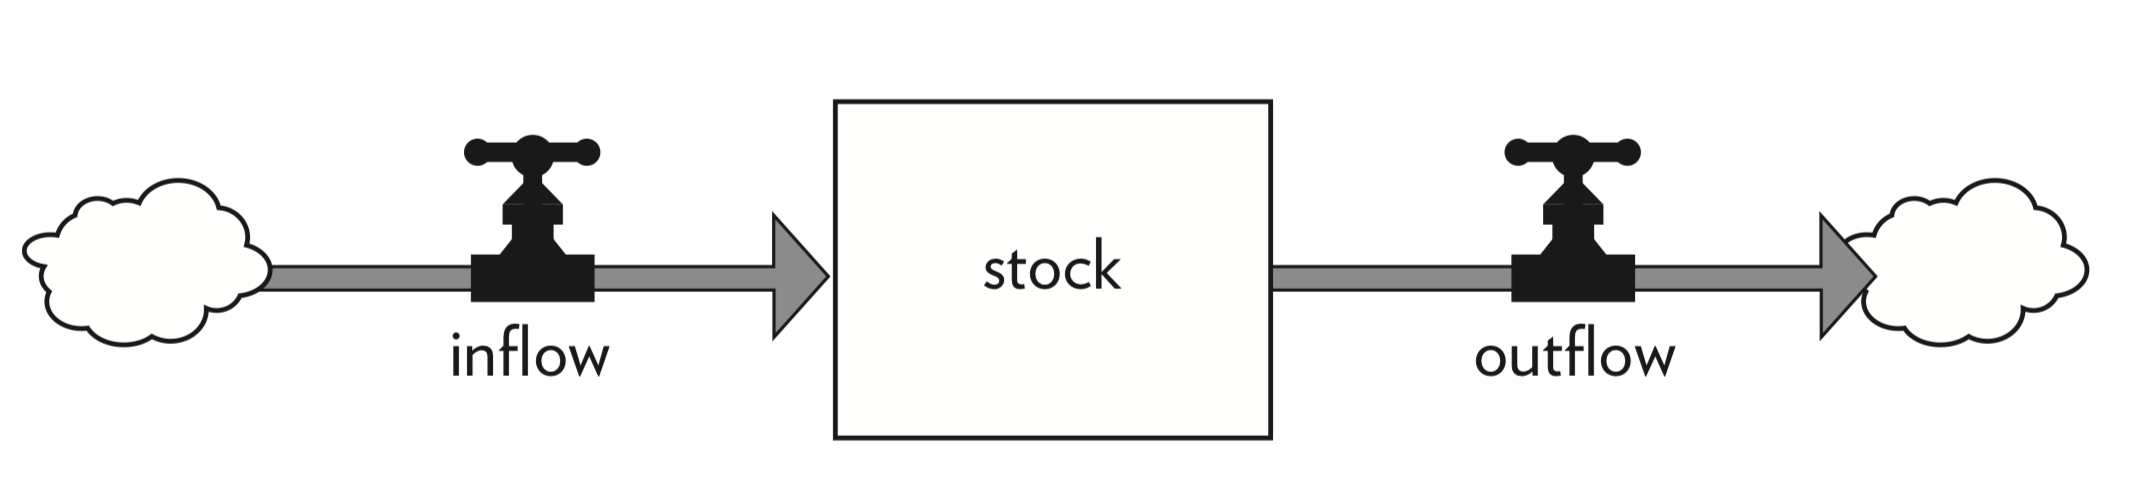 Thinking in Systems, pg. 18
Meadows goes on to describe the stock-and-flow diagram:
stocks are shown as boxes, and flows as arrow-headed “pipes” leading into or out of the stocks. The small T on each flow signifies a “faucet;” it can be turned higher or lower, on or off. The “clouds” stand for wherever the flows come from and go to–the sources and sinks that are being ignored for the purposes of the present discussion.
Cool! The drawings become increasingly complex as we add in additional stocks and flows and feedback loops. But looking back at our simple example got me thinking… could we replicate a stock-and-flow diagram in R?
Browsing the web, it seems like DiagrammeR is our best bet for a package that aids in the creation of diagrams and flowcharts. So, off we go!
First we need to install DiagrammeR.
install.packages("DiagrammeR")I actually had a minor snafu trying to install this on my Mac. Trying to compile a dependency package tidyr required opening up Xcode and accepting the user agreement. But after that we were all set.
Let’s load the DiagrammeR package:
library(DiagrammeR)So judging from the DiagrammeR website, I wasn’t too sure where to start. So I watched the embedded video, which showed the quick creation of a graph using the grViz function. It looks like this function will interpret some DOT syntax, which the web tells me is a ‘plain text graph description language.’ That seems cool, let’s give it a go!
grViz("

digraph boxes_and_cirles {

  # add nodes
  node [shape = box]
  stock

}
")
Not bad! We’ve got a stock! The other basic elements we will want to include would be: clouds at either end (representing sources and sinks), pipes, and faucets. Let’s try to get all of the elements together in one go.
grViz("

digraph boxes_and_cirles {

  # add nodes
  node [shape = box]
  stock
  cloud1
  cloud2
  inflow_faucet
  outflow_faucet

}
")
And then let’s connect the elements
grViz("

digraph boxes_and_cirles {

  # add nodes
  node [shape = box]
  stock
  cloud1
  cloud2
  inflow_faucet
  outflow_faucet

  # edge statements
  cloud1 -> inflow_faucet -> stock -> outflow_faucet -> outflow -> cloud2

}
")
Nice! Let’s try to flip this thing around. I did some googling and landed on some additional DiagrammeR documentation here. It seems like adding some settings to the graph object using graph [layout = dot, rankdir = LR] will do the trick
grViz("

digraph boxes_and_cirles {

  graph [layout = dot, rankdir = LR]

  # add nodes
  node [shape = box]
  stock
  cloud1
  cloud2
  inflow_faucet
  outflow_faucet

  # edge statements
  cloud1 -> inflow_faucet -> stock -> outflow_faucet -> outflow -> cloud2

}
")
Wow, this is off to a blazing start. Now comes the tough part: formatting everything to look nice, like the picture above. I couldn’t find a cloud shape from the list of shapes on the graphviz website, so I settled for the tripleoctagon. There also wasn’t a faucet shape off the shelf, so I settled for the frighteningly-named terminator shape. I added some labels, altered some sizes, and voilà:
grViz("

digraph boxes_and_cirles {

  graph [layout = dot, rankdir = LR]

  # add clouds
  node [shape = tripleoctagon]
  cloud1 [label = '']
  cloud2 [label = '']

  # add stock
  node [shape = box]
  stock [height = 1.2, width = 1.5]

  # add faucets
  node [shape = terminator,
        style = filled,
        fillcolor = black]
  inflow [label = '\n\ninflow', penwidth = 3]
  outflow [label = '\n\noutflow', penwidth = 3]

  # add pipes (edges)
  cloud1 -> inflow [arrowhead = none, penwidth = 2, color = DimGray]
  inflow -> stock [penwidth = 2, color = DimGray]
  stock -> outflow [arrowhead = none, penwidth = 2, color = DimGray]
  outflow -> cloud2 [penwidth = 2, color = DimGray]

}
")
Not bad, right!
Thanks to DiagrammeR creator Richard Iannone (@riannone) and contributors Kent Russell (@timelyportfolio), JJ Allaire (@rstudio), and Michaël Benesty (@pommedeterre33).
Thanks to Donella Meadows for an interesting book and some new perspectives on systems. Cheers!